Biochar & Climate change
Biochar is well known as an option to mitigate climate change. Here, we want to give the big picture & revisit some of the basic science behind it.
Last updated: January 19, 2022
Outline
A. Biochar in the global carbon cycle
To grasp the bigger picture, one must start with the global carbon cycle. Figure 1, reproduced from Friedlingstein & colleagues (2020, available online) describes two features of the global carbon cycle:
- The repartition of anthropogenic carbon dioxide emissions in the environment
- The magnitude of the fast and slow carbon cycles
)](../img/climate_GlobalCarbonCycle-web.png)
1. Repartition of anthropogenic carbon dioxide emissions
Looking at the thick arrows in Figure 1, this figure explains where anthropogenic emissions of carbon dioxide are distributed in various environmental compartments (ocean, atmosphere, terrestrial biosphere).
- On the one hand, anthropogenic emissions of carbon dioxide include: 9.4 GtC yr-1 of fossil carbon and 1.6 GtC of biogenic carbon arising from land use changes.
- On the other hand, this carbon is dispersed in the environment: 3.4 GtC yr-1 is taken up by vegetation, 2.5 GtC yr-1 is taken up by oceans, and 5.1 GtC yr-1 is taken up by the atmosphere.
You notice that there is a balance (neglecting here vulcano emissions & smaller uncertainties): (9.4 + 1.6) - (3.4 + 2.5 + 5.1) = 0. In addition, the +5.1 GtC yr-1 that add up in the atmosphere tells by how much the concentration of carbon dioxide in the atmosphere is increasing, and thereby sets the magnitude of the additional greenhouse effect arising from carbon dioxide.
2. Fast & slow cycles of carbon
Now, looking at the thin arrows in Figure 1, the figures explains the carbon cycling in the ocean, the terrestrial biosphere, rivers, lakes, and coastal areas. The geolocical carbon cycle is not visible, mainly because it is extremly slow (turnovers of millenias to millions of year) leading to small/neglectable natural flows. For the fast carbon cycles (daily to decadal & millenia turovers), the flows are much larger.
One is of particular interest to biobased technologies like biochar: the carbon cycle from vegetation, with its two main mechanisms photosynthesis & respiration. These flows are of about 120 GtC yr-1 (Ruy, Berry and Baldocchi, 2019). Biomass based removal technologies are basically trying to imbalance the two flows in this cycle: increase photosynthesis (biomass productivity) & slow down respirtation (biomass decomposition).
Anthropogenic carbon removals: how long is long enough?
In short, the longer the better. At minima, to have an effect on the climate system, the removal should last significantly longer than the turover rate of the carbon cycle from which the removed carbon came from.
[to be continued]
Global biochar carbon sequestration potential
There are few studies that estimated the potential for biochar production & related carbon sequestration in biochar. The potential could be up to 3 GtC yr-1 or, equivalently, 10 GtCO2 yr-1 (Cowie et al., 2024).
[to be continued]
B. Biochar carbon storage & climate change impact?
Biochar carbon sink, carbon sequestration, carbon removal, biochar decomposition, biochar stability, & climate impact of biochar systems.
All these terms are related. Some are synonyms. Some have different meanings. Let’s clarify them.
First, the largest difference is between the biochar carbon sink & climate change impact of a biochar system. It is illustrated in the Figure 2, below.
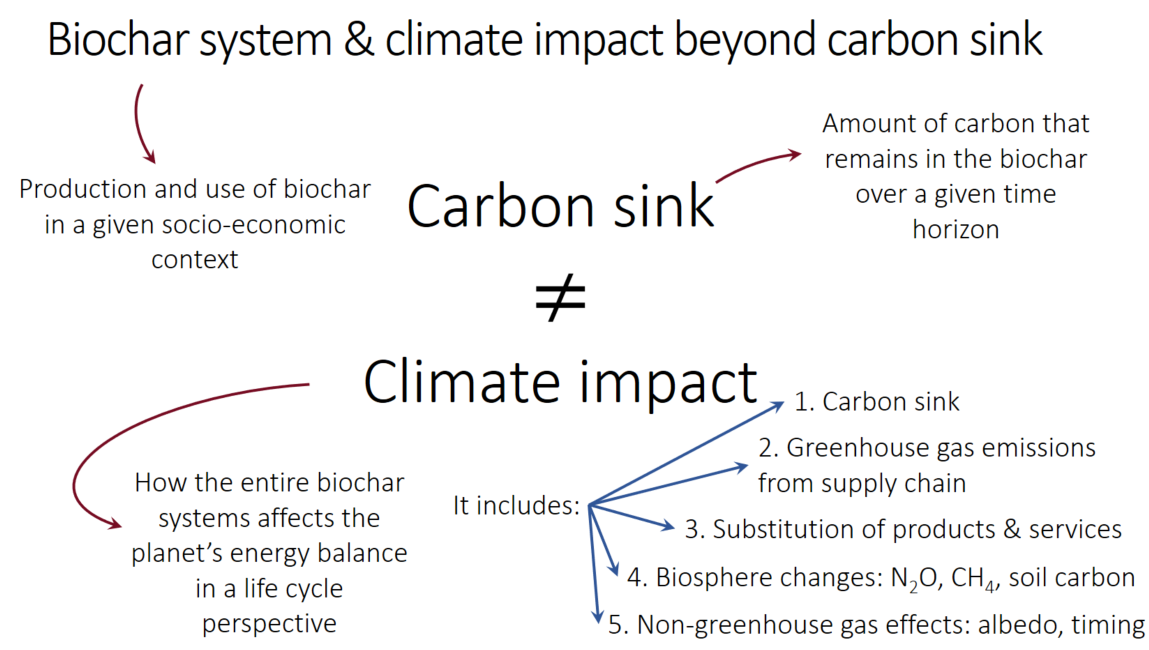
- Definitions of terms
- Reminder: what matters is that biochar systems mitigate climate change, from a life cycle perspective
- Insight from LCA research: biochar C sink term is largest contributor to overall climate impact of the systems. Hence, importance to ground assumption on stability on solid evidence
C. Biochar decomposition: how is it measured?
Basics in soil sciences
Biochar, the carbon-rich solid produced by pyrolysis of biomass under limited oxygen, offers a durable form of carbon when applied to soils. Its long-term stability in soil stems from the formation of fused aromatic structures during pyrolysis, structures that are much less prone to microbial decomposition compared to fresh biomass. In soil science terms, this durability or persistence (also referred to in policy contexts as durability of carbon storage) reflects how long biochar carbon remains stable and less reactive in soil systems.
Biochar in soils: main processes at play
When biochar is incorporated into agricultural soils, several processes shape its environmental role:
Its chemically stable, aromatic carbon structure slows microbial decomposition, enhancing carbon storage.
Biochar’s persistence varies depending on both its inherent properties (e.g., H/C atomic ratio, production temperature) and soil/environmental conditions.
In the project, biochar stability is modelled based on its H/C ratio and the mean annual temperature of its location, allowing estimation of the fraction of carbon remaining over time.
The Biochar Systems group at SLU has built on this by developing spatially explicit models and tools to analyze and quantify long-term biochar carbon storage in soils.
Incubation experiments, lab & field
A central component of the project is the integration of incubation experiments and field trials to better understand biochar’s real-world behavior:
Laboratory incubations are used to study biochar decomposition over controlled short time spans, helping parameterize persistence models.
Field trials have been established to monitor long-term behavior under actual agricultural conditions, allowing researchers to observe degradation and transport processes not observable in lab settings.
All data, including incubation results and field findings, is consolidated into an open database and integrated via a dedicated library and code repository, facilitating modeling, analysis, and transparency.
The project further provides practical guidelines on using these stability models for applications such as carbon accounting, LCA, and climate reporting.
Want to read more? Click here
D. Biochar stability estimates: how are they built?
Biochar stability estimates have been derived according to two main approaches:
- Physical or chemical oxidation & benchmarking against fossil coal
- Extrapolation of incubation data to long-time horizons
Here, we only cover the second approach as it relies on actual observations and is the dominant approach in the research literature.
The process to extrapolate incubation data to longer times is described in Figure 3, alongside with methodological choices that arise along the way.
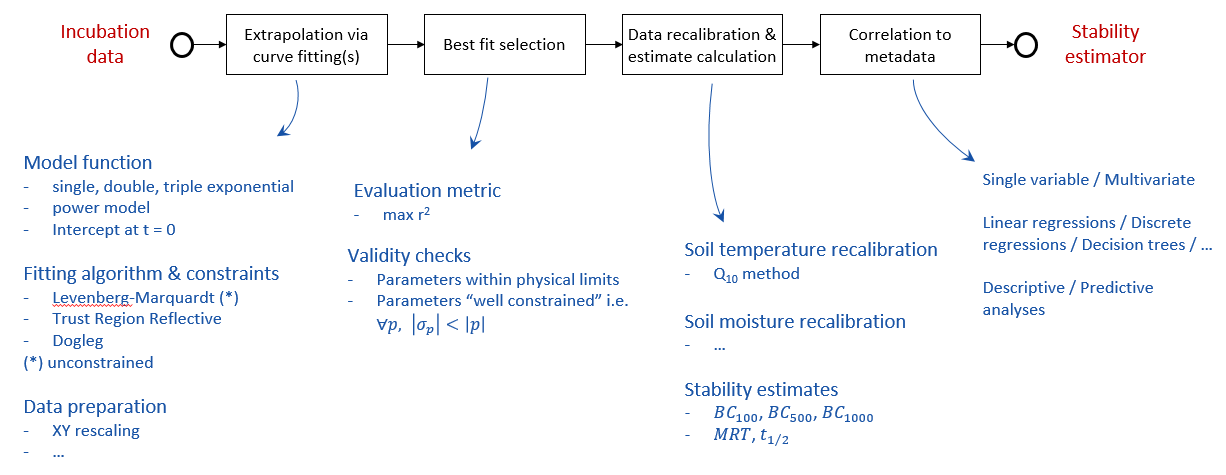
See more in Stability project.
E. Financing carbon removals & policy implications
Financing carbon removals in a shifting climate market
Financing climate action has traditionally focused on activities that avoid emissions, like preventing deforestation or displacing fossil fuels, but these strategies have faced questions on credibility. Today, markets, both voluntary and regulated, are moving toward verified carbon removals, including biochar, that stores CO₂ rather than merely avoid it.
Carbon removal as a trusted financial instrument
Carbon finance aims to channel capital toward actions with measurable climate benefits. Whether through avoidance or removal, these financial instruments hinge on trust in the project design, in robust verification, and in transparency. That said, purchasing such instruments should not be seen as a replacement for reducing emissions directly. Biochar-based carbon removal credits are gaining momentum in voluntary markets, reflecting the shift toward durable and verifiable removals in climate finance.
Emerging EU framework: CRCF in development
The EU is developing the Carbon Removal Certification Framework (CRCF), a voluntary, EU-wide certification system that will cover permanent removal methods such as biochar and carbon farming, based on principles like quantification, additionality, durability, and sustainability (read more here). Regulatory adoption occurred in late 2024, and the Commission is preparing delegated acts to define methodologies. Certification and the rollout of a centralized registry are expected to begin around 2026–2027, with full registry integration by 2028.
Policy implications
For biochar projects, aligning with the forthcoming CRCF will enhance credibility and lay the groundwork for future uptake in compliance and voluntary initiatives. As policy evolves from offsetting toward verified removals, transparent durability modelling, and alignment with external frameworks, will be key for scaling finance and market trust.
How do “biochar C removal certificates” work?
[to be continued]
Comparing some methodologies that estimate 100-year stabilities
[to be continued]