Biokol och klimat
Biokol är välkänt som ett alternativ för att mildra klimatförändringarna. Här vill vi ge helheten och återbesöka en del av den grundläggande vetenskapen bakom det.
Senast uppdaterad: 19 januari 2022
Outline
A. Biochar in the global carbon cycle
To grasp the bigger picture, one must start with the global carbon cycle (Figure 1, reproduced from Friedlingstein & colleagues (2020), available online).
Repartition of anthropogenic carbon dioxide emissions
Looking at the thick arrows, this figure tells us where anthropogenic emissions of carbon dioxide are distributed in various environmental compartments (ocean, atmosphere, terrestrial biosphere).
- On the one hand, anthropogenic emissions of carbon dioxide are made of: +9.4 GtC yr-1 of fossil emissions & 1.6 GtC of land use change emissions.
- On the other hand, this carbon is dispersed in the environment: 3.4 GtC yr-1 is taken up by vegetation, 2.5 GtC yr-1 is taken up by oceans, and 5.1 GtC yr-1 is taken up by the atmosphere. You notice that: (9.4 + 1.6) - (3.4 + 2.5 + 5.1) = 0.
There is a balance (neglecting here vulcano emissions & smaller uncertainties). Reminder: these +5.1 GtC yr-1 in the atmosphere tells us by how much the concentration of CO2 in the atmosphere is increasing, and thereby the magnitude of the additional greenhouse effect.
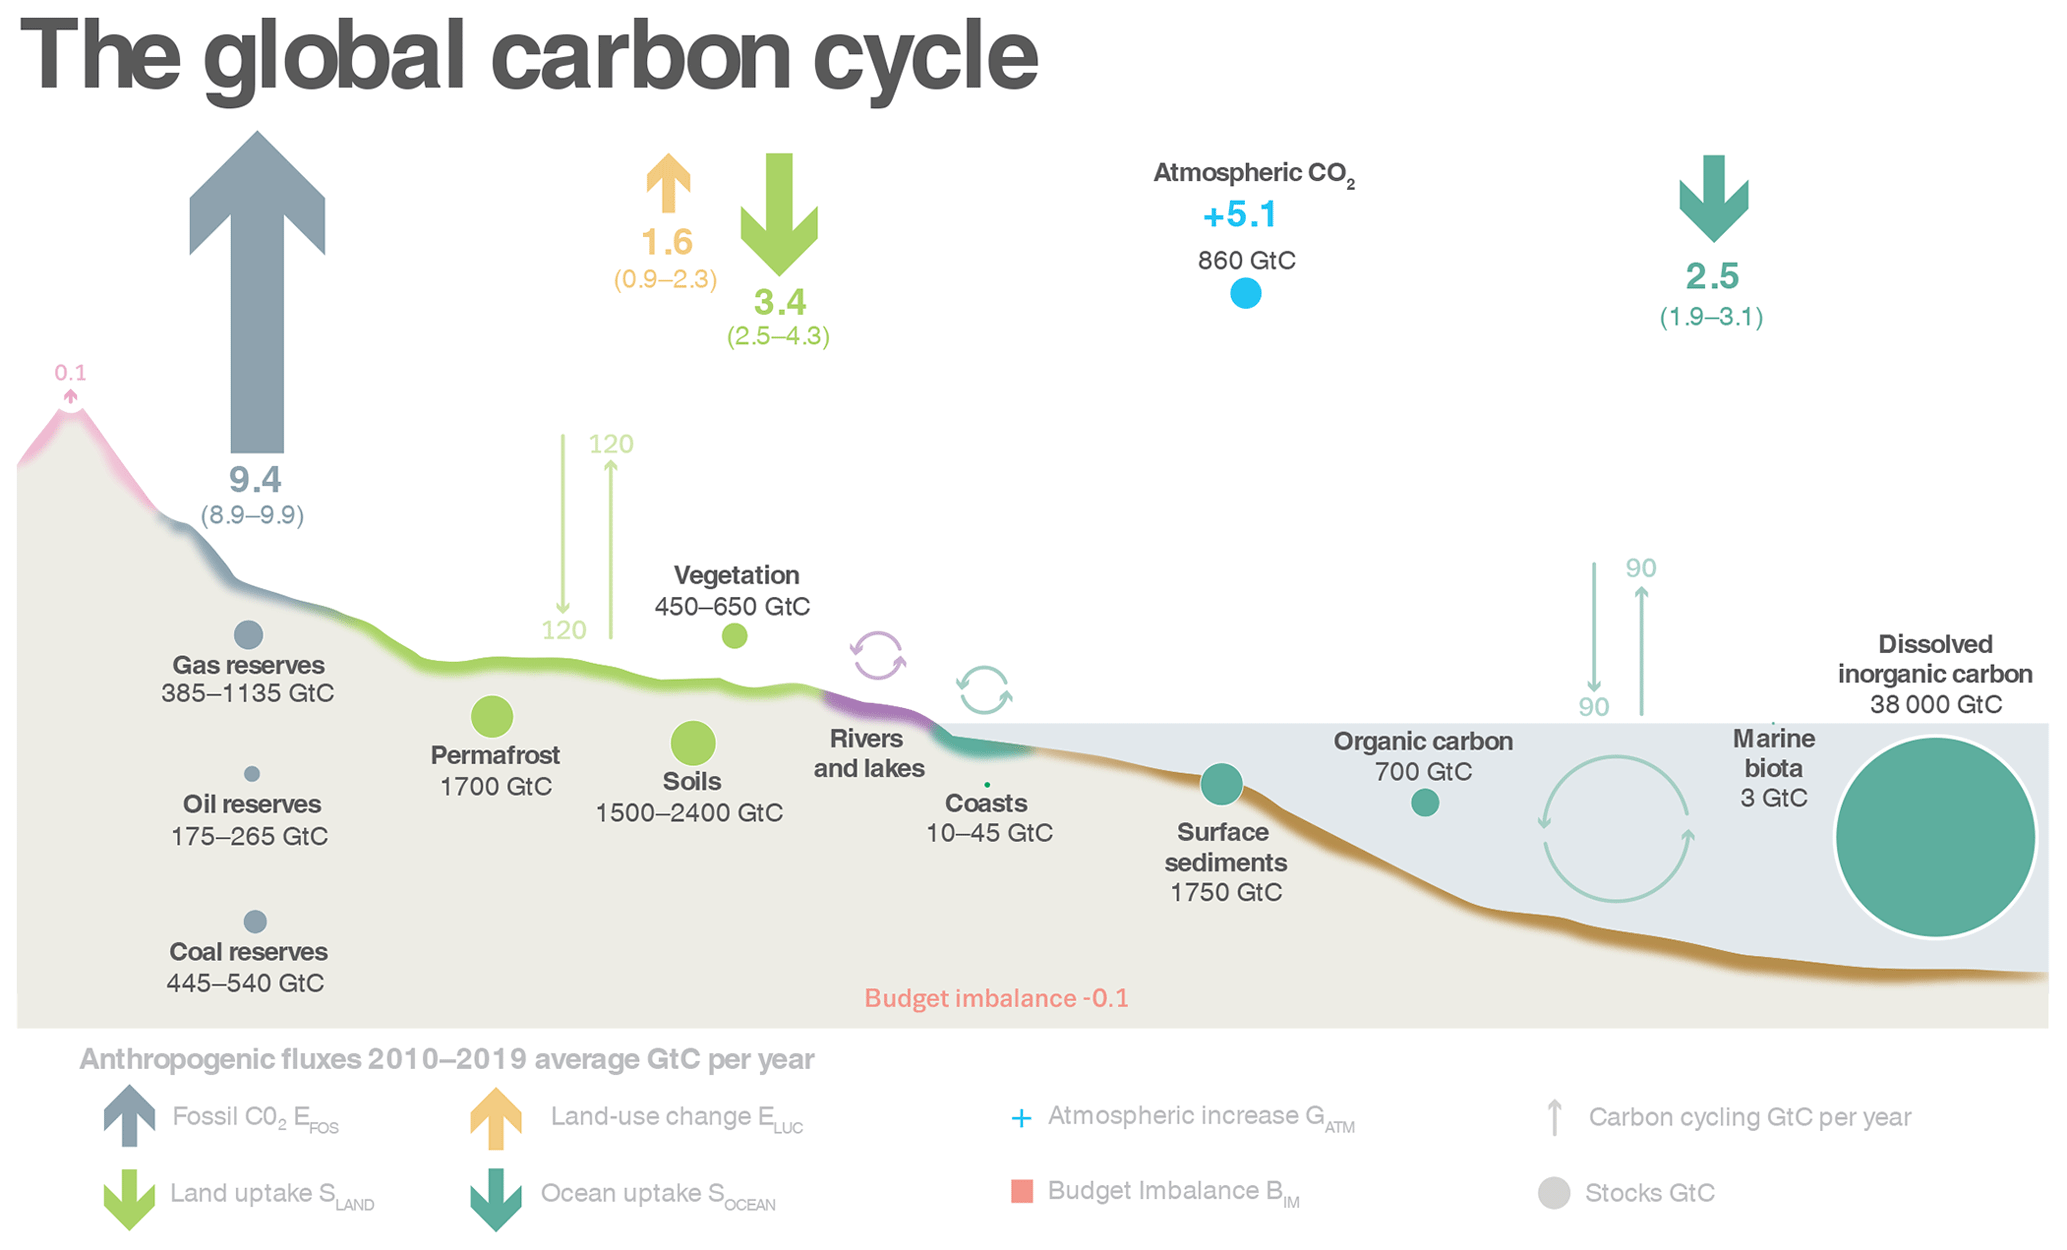
Fast & slow cycles of carbon
Now, looking at the thin arrows, the figures tells us about carbon cycling in the ocean, the terrestrial biosphere, rivers, lakes, and coastal areas. The geolocical carbon cycle is not visible, mainly because it is extremly slow (turnovers of millenias to millions of year) leading to small/neglectable natural flows. For the fast carbon cycles (daily to decadal & millenia turovers), the flows are much larger.
One is of particular interest to biobased technologies like biochar: the carbon cycle from vegetation, with its two main mechanisms photosynthesis & respiration. These flows are of about 120 GtC yr-1 (Ruy, Berry and Baldocchi, 2019). Biomass based removal technologies are basically trying to imbalance the two flows in this cycle: increase photosynthesis (biomass productivity) & slow down respirtation (biomass decomposition).
Anthropogenic carbon removals: how long is long enough?
In short, the longer the better. At minima, to have an effect on the climate system, the removal should last significantly longer than the turover rate of the carbon cycle from which the removed carbon came from.
[to be continued]
Global biochar carbon sequestration potential
There are few studies that estimated the potential for biochar production & related carbon sequestration in biochar. The potential could be up to 3 GtC yr-1 or, equivalently, 10 GtCO2 yr-1
[to be continued]
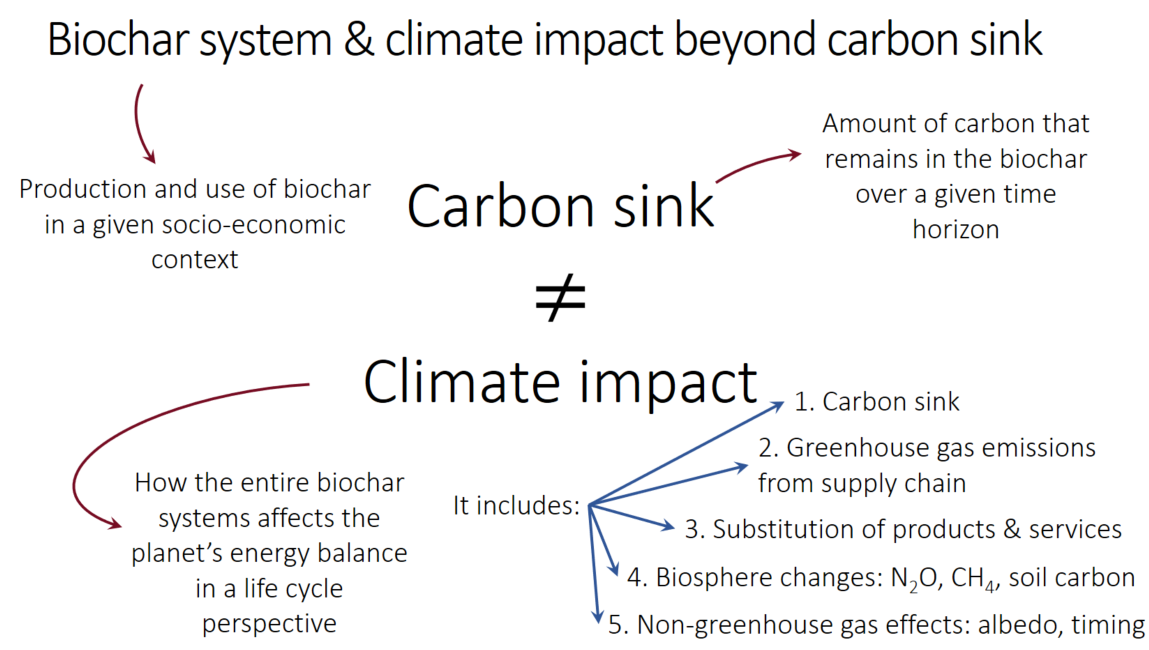
## B. Biochar carbon sink & climate change impact?
Biochar carbon sink, carbon sequestration, carbon removal, biochar decomposition, biochar stability, & climate impact of biochar systems.
All these terms are related. Some are synonyms. Some have different meanings. Let’s clarify them.
First, the largest difference is between the biochar carbon sink & climate change impact of a biochar system. It is illustrated in the Figure 2, below.
[to be continued]
- Definitions of terms
- Reminder: what matters is that biochar systems mitigate climate change, from a life cycle perspective
- Insight from LCA research: biochar C sink term is largest contributor to overall climate impact of the systems. Hence, importance to ground assumption on stability on solid evidence
## C. Biochar decomposition: how is it measured?
[to be continued]
- Basics in soil sciences
- Biochar in soils: main processes at play
- Incubation experiments, lab & field
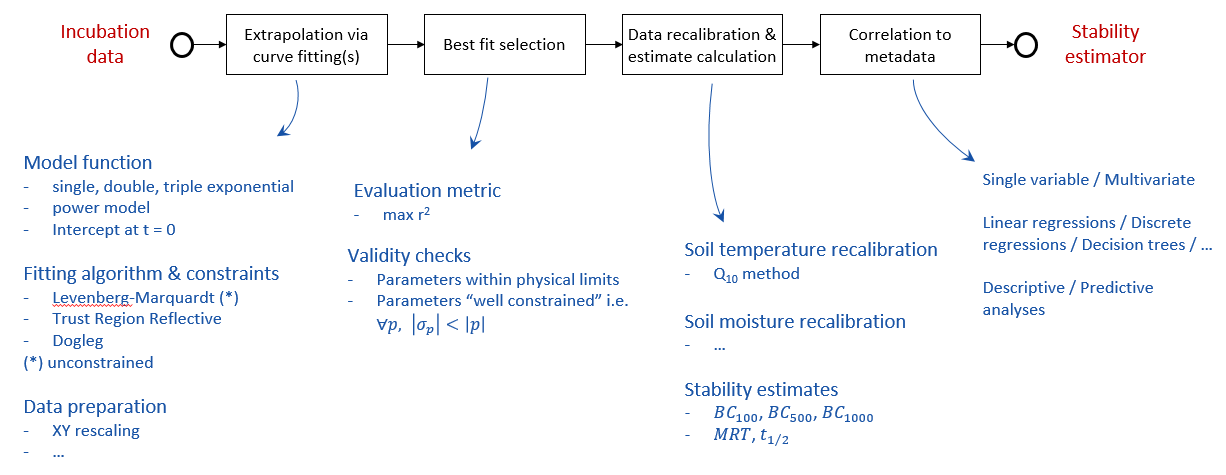
## D. Biochar stability estimates: how are they built?
Biochar stability estimates have been derived according to two main approaches:
- Physical or chemical oxidation & benchmarking against fossil coal
- Extrapolation of incubation data to long-time horizons
Here, we only cover the second approach as it relies on actual observations and is becoming the dominant approach in the recent research literature.
The process to extrapolate incubation data to longer times is described in Figure 3, alongside with methodological choices that arise along the way.
[to be continued]
Description of the extrapolation process
- long term extrapolation
- correlation to properties
Published analyses of biochar incubation data & suggested correlations
.
.
.
.
## E. Financing carbon removals & policy implications
Financing action to mitigate climate change has a long history. For several decades, it took the form of climate compensation through the financing of projects that avoided fossil fuel emissions, deforestation, or encouraged replanting of trees. This was not without debate & distrust. Today, the compensation or offsetting market is moving towards new types of projects: carbon removal projects.
Let’s be clear:
- The role of finance is to catalyse change by channelling resources where needed
- Climate compensation are a type of financial product, available on voluntary & regulated markets
- Climate financial products are built on trust in the seller & feelings created for buyers
- Buying climate compensation products can never be a substitute to reducing one's greenhouse gas emissions
When it comes to biochar, in the early 2020s, “biochar C removal certificates” have been defined & are being sold on a non-regulated voluntary market by a handful of organisations.
How do “biochar C removal certificates” work?
[to be continued]
Comparing some methodologies that estimate 100-year stabilities
[to be continued]
| Your biochar data | |||
| Calculation methods & returned values | ||||||||||
| Method | IPCC (2019) | IBI (2013) | Spokas O:C (2010) | EBC C-sink (Agro) | EBC C-sink (Charcrete) | |||||
|---|---|---|---|---|---|---|---|---|---|---|
| 100-year stability (%) | n/a | n/a | n/a | n/a | n/a | |||||
| 100-year C sequestration (kg C/tonne biochar) | n/a | n/a | n/a | n/a | n/a | |||||
| 100-year CO2 sequestration (kg CO2-eq/tonne biochar) | n/a | n/a | n/a | n/a | n/a | |||||
| CO2 sequestration after
years (kg CO2-eq/tonne biochar) | n/a | n/a | n/a | n/a | n/a | |||||
| Notes | Enter your biochar properties in the first row for the calculations to start... | |||||||||